KPI Viz on Call Center
KPI-Visualization on Call-Centre
KPIs (Key Performance Indicators) are quantifiable measurements used to gauge a company’s overall long-term performance. This helps to weigh and determine a company’s strategic, financial, and operational achievements. They are used to measure a company’s success in relations to its set goals and targets. High-level KPIs may focus on the general overview of the performance of the business, while low-level KPIs may focus on processes in departments such as tech, sales, marketing, HR, support and others. KPIs are more than just numbers in weekly reports - they enable the key business players understand the performance and overall growth of their business so that they can make critical adjustments in the execution of their strategic goals. Knowing and measuring the right KPIs will help achieve results faster.
For this KPI Visualization, I used the PwC Forage Internship Call Centre Dataset. The task was to give the manager an accurate overview of long term trends in customer and agent behaviour. The dataset contains a record of 5000 calls made in the call centre. The possible KPIs required were
- Overall customer satisfaction
- Overall calls answered/abandoned
- Agent’s performance quadrant -> average handle time (talk duration) vs calls answered

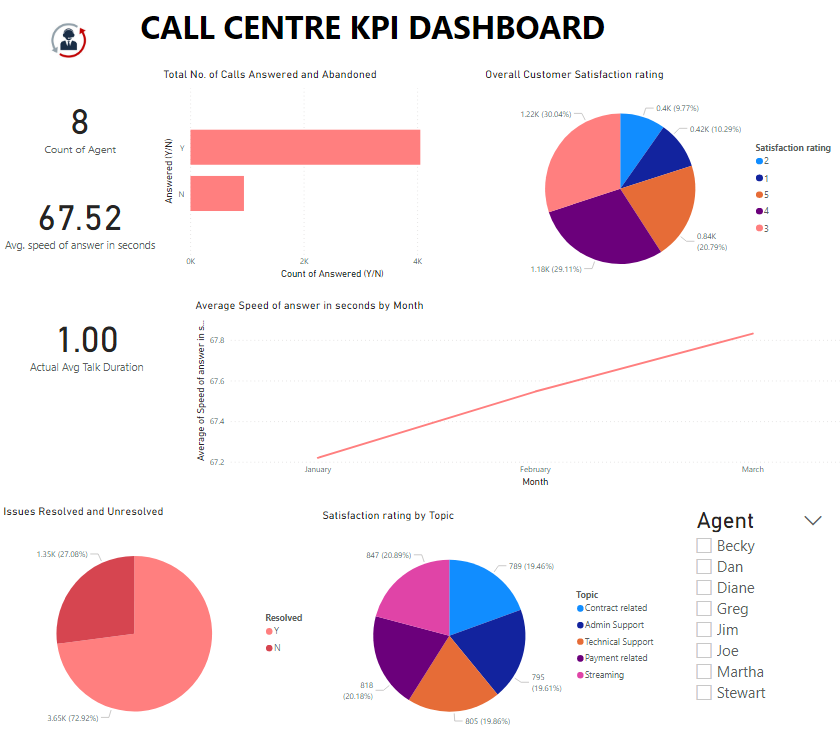
The Dashboard above shows
- The total number of Agents working in the call centre
- Average speed of answer in seconds
- Total number of calls answered and the total number of calls abandoned
- The overall customer satisfaction rating between 1 - 5
- The average speed of answer i.e time taken to answer a call (in seconds)
- A piechart showing the total number of the resolved and unresolved issues category
- A chart showing the overall satisfaction rating for the various topics a call was made for
- A slicer that can be used to derive more insights from the dashboard.

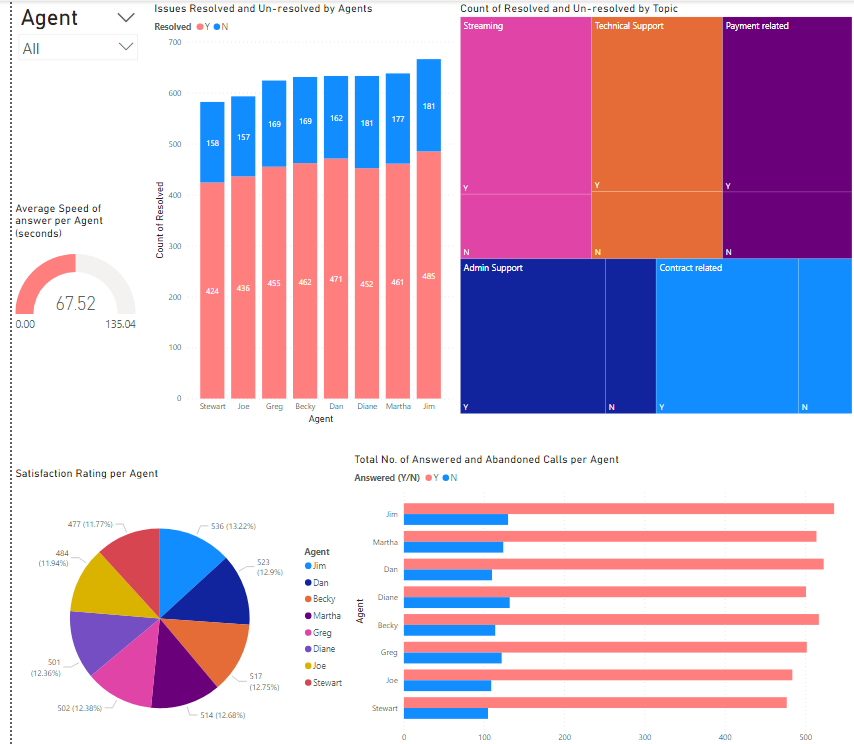
This second dashboard shows an overview of the agents performance behaviour. It indicates;
- The total number of issues resolved and un-resolved per agent
- Their average speed of answer
- Count of issues each agent was able to resolve and the unresolved
- Customer satisfaction rating per agent
- The total number of answered and un-answered calls per agent.
- A slicer that can be used to drill through and observe individual agent behaviour.
Observation and Conclusion; The average speed of answer has gone up over the month and this is quite commendable, there is also a huge difference betwwen the number of calls answered and abandoned as well as the issues resolved and un-resolved. The agents performace also shows dedication to their job at the call centre.
Recommendation; The call centre’s performance is on the average considering that 3 has the highest count for overall customer rating. The management should invest in more technological instruments that would make the centre’s daily task easier and faster, more agents should also be hired to fill in the slacking edges. They should also organize more workshops and trainings to educate agents on how to resolve certain issues and provide better customer services.